01 · The tool
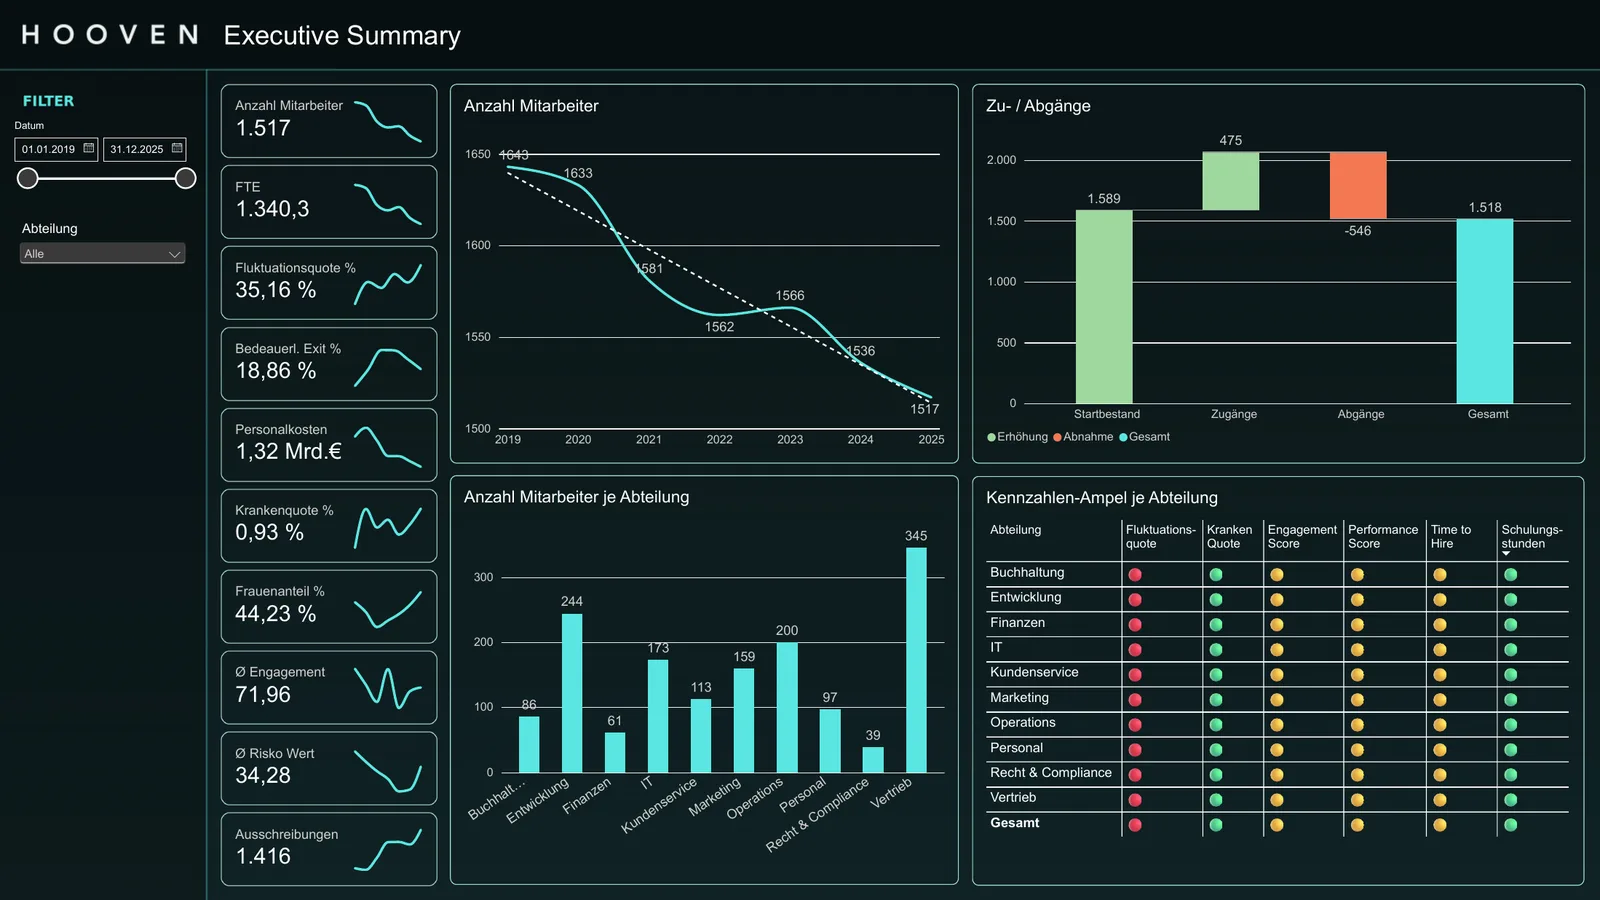
HR dashboard
An interactive Power BI report for your own analysis – in Basic, Advanced or Premium with 7 to 31 report pages.
- For:
- HR, management, department heads
- Rhythm:
- ongoing, data refreshed daily to monthly
The dashboard is the tool, the monitoring is the steering and the reporting is the interpretation. Individually or as a package – and because everything runs on the same data, each product can be added with little effort.
An interactive Power BI report for your own analysis – in Basic, Advanced or Premium with 7 to 31 report pages.
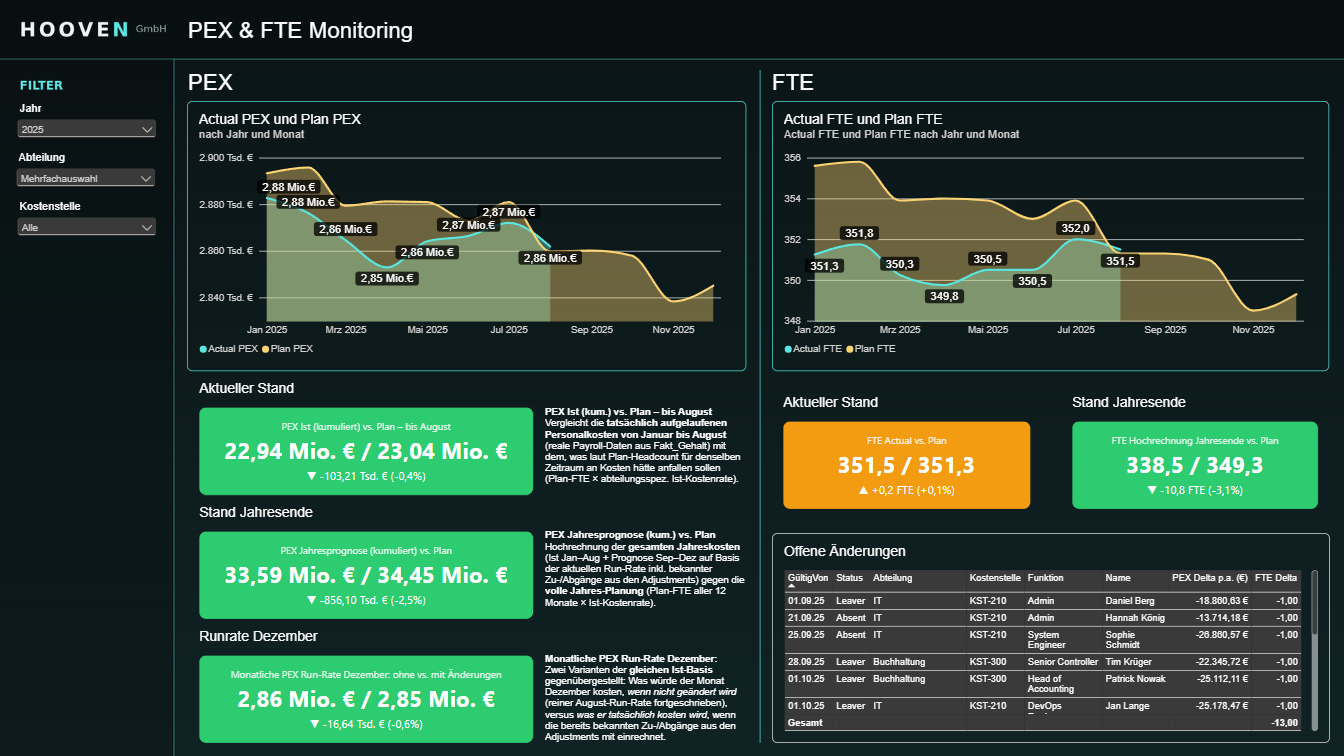
Plan, actual and forecast for personnel expenses (PEX) and FTE per cost centre – with gaps, variances and a projection to year-end.
A fully interpreted report with key figures, notable changes and recommendations – no need to open the dashboard yourself.
The tiers differ by the question you want to answer – and by the data you can provide for it. You can upgrade at any time.
What is the situation?
Headcount, costs, absence
Already shows the plan-versus-actual comparison of headcount.
Why and where?
Causes, demand, steering
Adds causes and demand coverage.
What’s at risk and what to do?
Forecast, risk, succession
With predictive values such as resignation probability and risk score. Pages with individual-level assessments use role-based access and are usually agreed with the works council.
Every month, the monitoring compares plan, actual and forecast per cost centre and shows where gaps or surpluses arise – also available without the dashboard, for example for your finance team.
Plan, actual and forecast per cost centre, gaps, full-year projection. For companies with annual headcount planning.
Standard plus variance analysis by volume and price, up to three scenarios and support in the planning round. For companies with a budget process and controlling.
Every month, a fully interpreted report: what has changed, what stands out, what you should do. Delivered by the 10th working day of the following month.
“The year-end forecast is slightly above plan. The cause is not higher workload across all areas, but three hires that start later than planned. We recommend bringing two key positions forward and will check next month whether the run rate responds.”
3–5 pages with key figures and notable changes at Basic scope.
8–12 pages covering all Advanced topics, including turnover and cost analysis.
12–20 pages including risk and succession, plus a 60-minute review each month and a deep dive each quarter.
Reporting requires the dashboard at the matching tier, as both are based on the same data.
A package costs less than booking each product separately – and a 24-month term lowers the price further.
For getting started with HR key figures
For active workforce and cost steering
For groups and complex structures
All prices are net plus VAT, valid for up to 1,000 employees, as of October 2026. The individual quote is binding. This offer is intended exclusively for businesses.
For Basic, HR master data, payroll and absence/holiday data are enough. Advanced adds applicant tracking, time recording, performance reviews, employee surveys and cost centres. Premium also uses ERP, project, succession, location and ESG data. We work with structured exports from your source systems.
Yes, licences are not included. Everyone who uses the dashboard needs Power BI Pro or Premium Per User. Pro is already included in Microsoft 365 E5; from a Fabric capacity of F64, viewers no longer need their own licence.
Monthly fees apply up to 1,000 employees. Each additional 1,000 or part thereof adds 20 %.
Yes, at any time. All tiers run on the same data model; when upgrading you only pay the difference in setup.
Access is role-based. We show health and pay data as group values. The basis is a data processing agreement under the GDPR; pages with individual-level assessments are usually agreed with the works council.
We’ll show you what’s in your people data – and which package fits you.