
HR controlling & people analytics
Know what happened.
See what’s coming.
HR dashboard, PEX/FTE monitoring and a monthly report from one source. For people decisions based on numbers that management, HR and finance can all trust.
01 — The question
Where will we be at year-end?
Most companies know exactly what has happened. Few see in time what comes next – even though the answer is already in their data.
- Management
- needs a picture that fits into one meeting: where the company stands and where it is heading.
- Head of HR
- needs reliable figures on demand and succession – and reports that don’t have to be rebuilt every month.
- Finance
- needs personnel costs and FTE in the same logic as the budget – with data both sides trust.
02 — A look inside
This is what monitoring and dashboard look like.
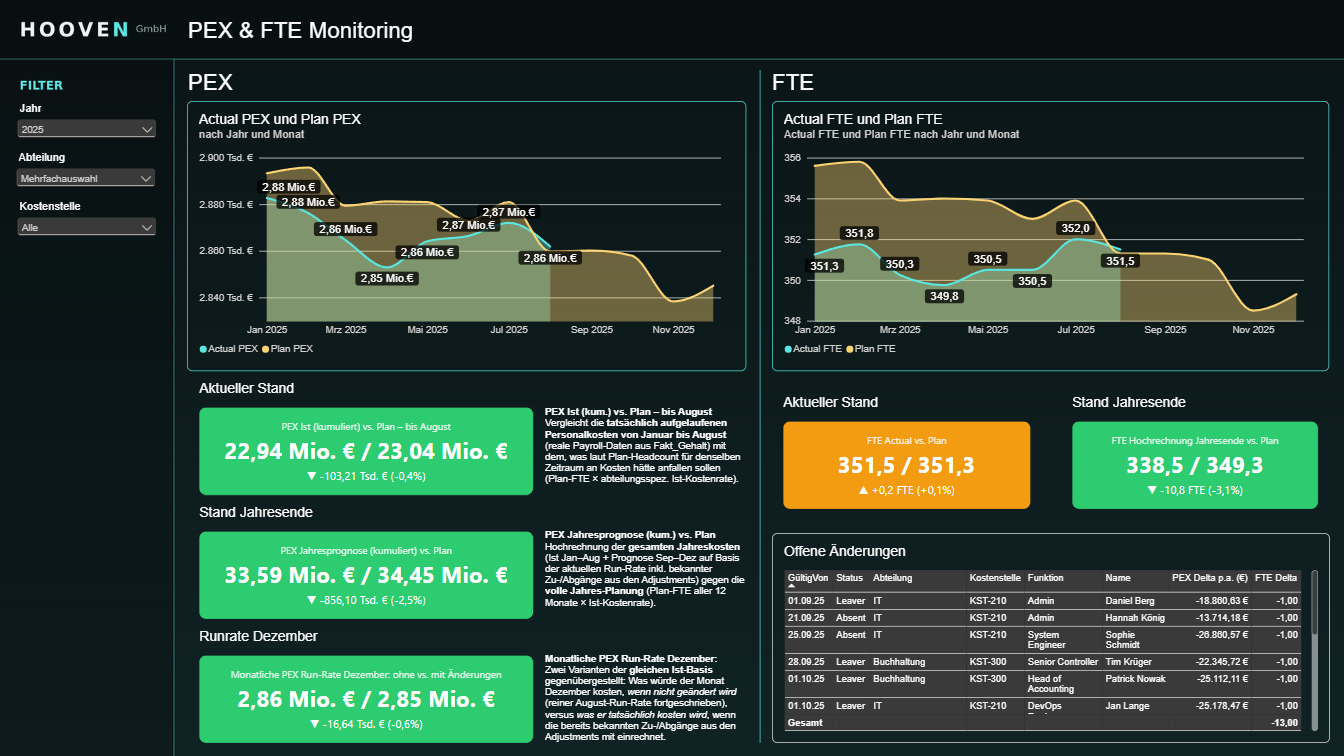
Real views from Power BI, shown with sample data: the PEX/FTE monitoring and pages from the HR dashboard, which has 31 report pages in the Premium tier. The dashboards themselves are in German.
03 — What you get
Three products on one data model.
-
01
HR dashboard
The tool
An interactive Power BI report for your own analysis – Basic with 7, Advanced with 18 or Premium with 31 report pages.
For HR, management and department heads · data refreshed daily to monthly
-
02
PEX/FTE monitoring
The steering
Plan, actual and forecast for personnel expenses and FTE per cost centre – projected to year-end, including all known joiners and leavers.
For finance, controlling and management · updated monthly
-
03
Monthly reporting
The interpretation
A fully interpreted report with key figures, notable changes and recommendations – delivered by the 10th working day of the following month.
For management and companies without in-house analysts · as PDF, optionally with a review call
from €1,490 per month as a package · setup from €1,500 · plus VAT
See packages and services04 — The areas
Eight questions. One data foundation.
All areas use the same master data and filters. A spike in turnover can be checked straight away against pay, leadership and sickness rates.
- Workforce
- How is our team made up – and how is it ageing?
- Fairness
- Are pay and leadership roles evenly distributed?
- Retention
- Who leaves, why – and who is irreplaceable?
- Hiring
- How efficiently do we hire – and what does it cost?
- Cost & performance
- Where does the money go – and what does it deliver?
- Health & time
- Where do absences and workload peaks occur?
- Talent & succession
- Are our key positions covered?
- Steering
- What does the future look like – and where are the risks?
05 — Reliability
Check first, then calculate.
A shifted reporting date, a duplicate employee ID, a salary with a misplaced decimal point: small errors, big impact. That is why every figure runs through the same pipeline – and errors are flagged before they reach a key figure.
- SourceSystems connected automatically
- ValidationReporting date, completeness, duplicates, plausibility, consistency
- CalculationEvery key figure defined once and documented
- Sign-offConfirmed by the people responsible
- DashboardThe same number everywhere
Role-based access. Managers see their area, HR leadership sees the whole picture.
Patterns, not people. Health and pay data appear as group values.
Properly agreed. Data processing agreement under GDPR, alignment with the works council where needed.

06 — Who’s behind it
“The answer is almost always already in the data. It’s just spread across many systems.”
In executive search I kept hearing the same question: how many people do we really need – and what will that cost us by year-end?
For more than twelve years, both sides have been my passion: the people behind the positions and the numbers behind them. Today, as a team, we build HR dashboards and PEX/FTE monitoring in Power BI for our clients – so they can plan changes and spot gaps before they become expensive. And when a position is missing, we find the right person too.
Dennis FrankeManaging Director · HR Professional / Data Analyst
More about HOOVEN07 — An example
What monitoring shows in August that would otherwise only surface at year-end close.
A typical mid-sized company with around 350 FTE · Steering package
The starting point
Headcount planning lives in Excel, actual costs come from payroll. The two sources are never combined – a variance only shows up at year-end close.
What HOOVEN connects
Master data, payroll and planning come together in one data model; validation rules secure reporting dates and cost centres. The PEX/FTE monitoring projects to year-end every month – with every known change.
What monitoring shows
Up to August, personnel costs are almost exactly on plan. But 13 known leavers and absences are already factored in: 338.5 instead of 349.3 FTE at year-end – 10.8 FTE below plan. Management sees in August where replacements will be needed, not in December.
And when the numbers show someone is missing?
Our roots are in executive search. Where your monitoring reveals a gap, we fill it – specialists and managers in IT, finance and HR.
Let’s talk for 20 minutes.
We look at your systems and questions together – and you see what’s in your people data.
- 1Call and current-state review
- 2Data connection and validation rules
- 3Dashboard and monitoring go live
- 4Monthly report and expansion